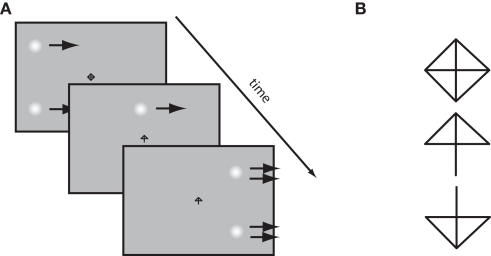
Figure 2.
(A) Outline of the time course for a rightwards, step up trial. Gaussian patches start moving rightward. After some interval of time the fixation stimulus changes to an arrow, signaling that a saccade to the top patch should be made. After this, the patches step up in speed (illustrated by the double arrows). Note that patches and fixation point are not to scale, for illustration purposes. (B) The fixation stimulus. Removal of either the bottom two or top two diagonal line segments results in an arrow indicating which patch to saccade to.

