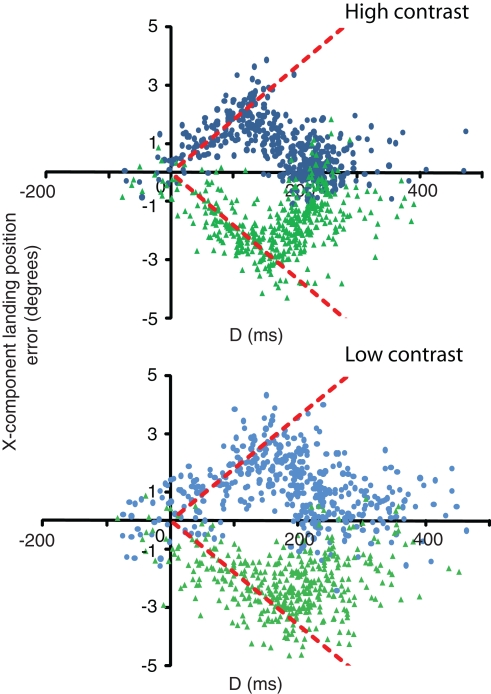
Figure 3.
D (time between velocity change and saccade onset) versus the x-component error in saccade landing positions for a single observer (observer 1). Data are separated out by contrast condition. Green triangles denote speed step up trials; blue circles denote speed step down trials. Predicted behavior based solely on the post-step speed corresponds to zero-error (i.e., the x-axis). Predicted behavior based solely on the pre-step speed is shown by the red dashed lines.

