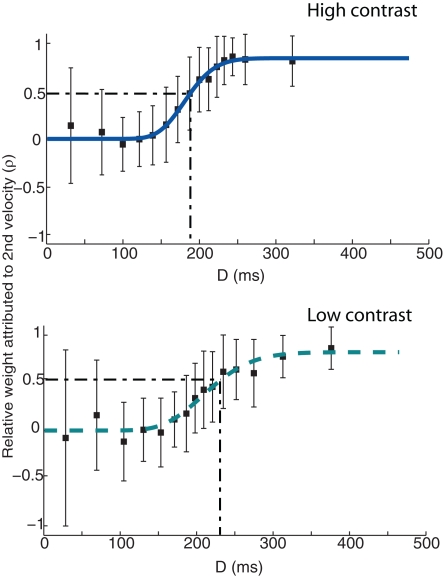
Figure 4.
ρn (the relative weight attributed to the post-step velocity) as a function of D (time between velocity change and saccade onset) for a single observer. Dark blue solid line in the top panel denotes the fit of a cumulative Gamma function to the high contrast condition data. Light blue dashed line in the lower panel denotes a Gamma function fit to the low-contrast data. Error bars denote the SD. The dash–dot line in both plots denotes the time at which σn = 0.5, i.e., when both velocities are being weighted equally. Note that while the data are presented here in approximately 15 equal bins, the actual Gamma fit was conducted on the full data set.

