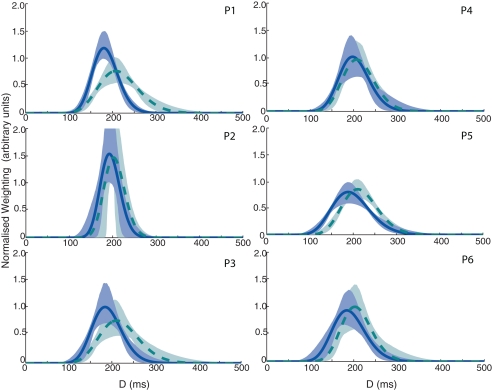
Figure 5.
Velocity integration filters for all six observers in Experiment 1. Solid dark blue line denotes the plot based on the high contrast data; dashed light blue line denotes the plot for the low-contrast data. Shaded areas indicate 95% confidence limits based on 10,000 bootstrap replications (dark blue and light green for high and low-contrast conditions, respectively).

