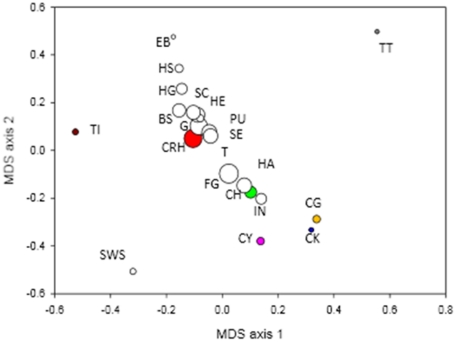
Figure 6. Plot of the first and second axis of a multidimensional scaling analysis based on pairwise FST values among populations.
Size of symbols is proportional to the nucleotide diversity of populations. Native populations are colour coded according to Table 1.

