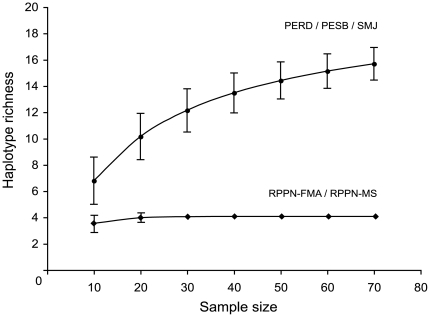
Figure 3. Rarefaction analysis showing the changes in haplotype richness relative to successive increments in sample sizes.
Rarefaction curves of two groups of populations sampled for at least ten individuals. The test was significant for the differences in haplotype richness between these groups (t = 12.5, df = 19, P<0.0001). The mean number of haplotypes found in 10 samples randomly drawn from the group PERD/PESB/SMJ was 7.0 (SD = 1.3), whereas the mean was roughly half as much (X = 3.5, SD = 0.2) for the groups found in smaller areas (RPPN-FMA/RPPN-MS).

