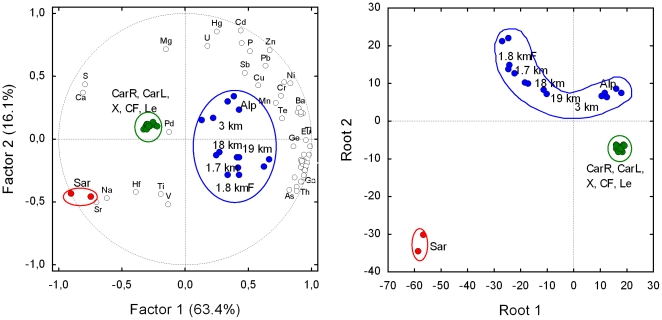
Figure 3. Left: bi-plot after Principal components and classification analysis based on correlation of the content of the 54 chemical elements (empty marker, not all labelled) in the 29 soil samples (full marker).
The variance explained by the each principal component is shown in parentheses. Right: plot of canonical scores after Discriminant analysis with canonical analysis performed with the four chemical elements most, and significantly, correlated (absolute value) with factor 1 (Cs, Ga, Ca, S) and factor 2 (Cd, Zn, Hg, Sr). Classification of soil samples has an high probability to be correct (93%) as the predicted classification deviates only for sample “Le”, that is not distinct from “X” (see fig. 1d). Since these two samples are in the same group (the green one), group classification is 100% correct. For technical details of multivariate techniques see Statistica 7.0 Electronic Manual (Statsoft Inc., 2005).

