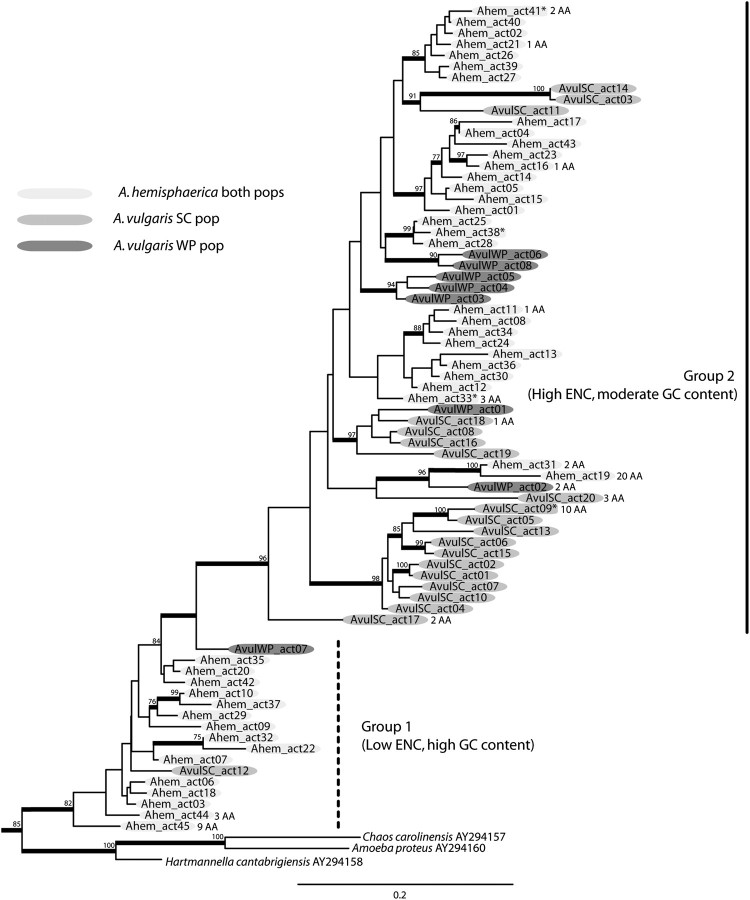
Fig. 4.
Most likely genealogy of the actin gene family in the genus Arcella inferred from maximum likelihood. For this reconstruction, we performed a RaxML analysis using the GTR model of evolution with 300 bootstrap replicates on the data set “Actin Alignment B,” which consists of 795 nucleotides; third positions are included. Genes are colored according to lineage. Most genes (59) code the exact same amino acid sequence. A minority of genes (14) encode divergent amino acid sequences; these are indicated by the number of AA substitutions. Sequences with an asterisk (*) represent putative pseudogenes. Thicker branches represent nodes that have >75% BS. All branches are drawn to scale. Dashed lines represent paraphyletic groupings.

