
FIG. 8.
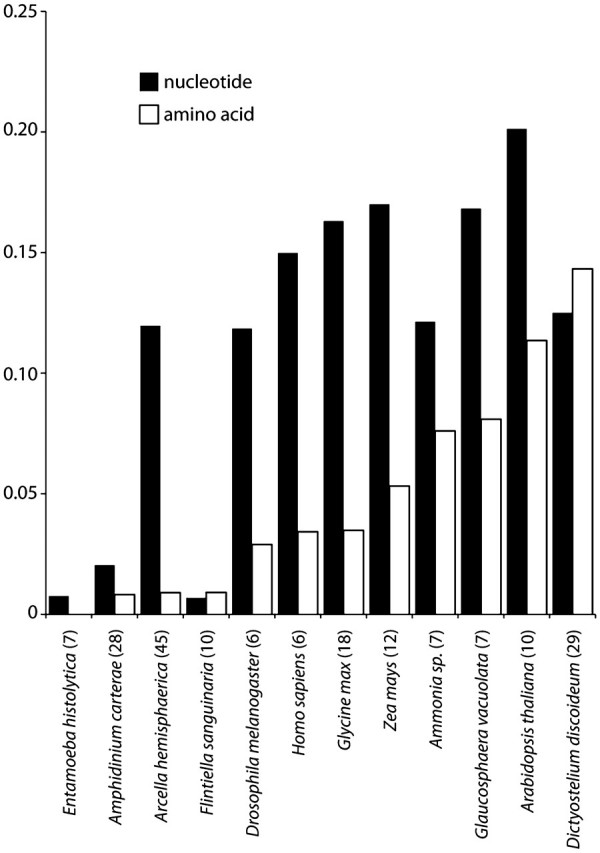
Average pairwise distances within actin gene paralogs for different eukaryotic taxa. The number of members in each family is indicated in parenthesis after the organism name on the x axis. The distances were calculated as uncorrected pairwise distances and then averaged over the number of actins in the taxon.