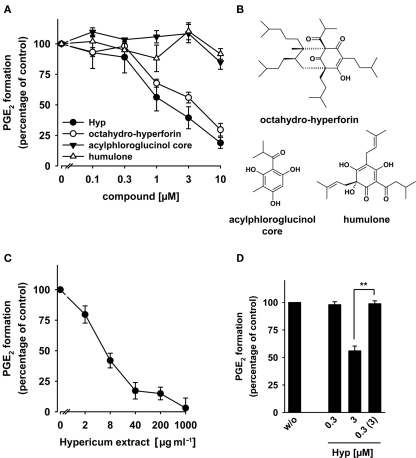
Figure 4.
Effects of hyperforin on the activity of mPGES-1. (A) Concentration–response curves for Hyp, octahydro-hyperforin, the acylphloroglucinol core, and humulone. (B) Chemical structures of octahydro-hyperforin, the acylphloroglucinol core, and humulone. (C) Concentration–response curves for a St. John's wort extract. (A,C) For studies of mPGES-1 inhibition, microsomal preparations of IL-1β-stimulated A549 cells were pre-incubated with vehicle (DMSO) or the test compounds at the indicated concentrations for 15 min at 4°C, and the reaction was started with 20 μM PGH2. After 1 min at 4°C, the reaction was terminated using a stop solution containing FeCl2 and 11β-PGE2 (1 nmol) as internal standard. The 100% values in the individual experiments are in the range of 3–4 μg ml−1 PGE2. Data are given as mean ± SE, n = 3–4. (D) Reversibility of mPGES-1 inhibition by Hyp. Microsomal preparations of IL-1β-stimulated A549 cells were pre-incubated with 3 μM inhibitor for 15 min at 4°C. An aliquot was diluted 10-fold to obtain an inhibitor concentration of 0.3 μM. For comparison, microsomal preparations were pre-incubated for 15 min with 0.3 μM Hyp or with vehicle (DMSO), and then, 20 μM PGH2 was added (no dilution). Then, all samples were incubated for 1 min on ice, and PGE2 formation was analyzed as described by RP-HPLC. Data are given as mean ± SE, n = 3–4, **p < 0.01 vs. vehicle (0.1% DMSO) control, ANOVA + Tukey HSD post hoc tests.

