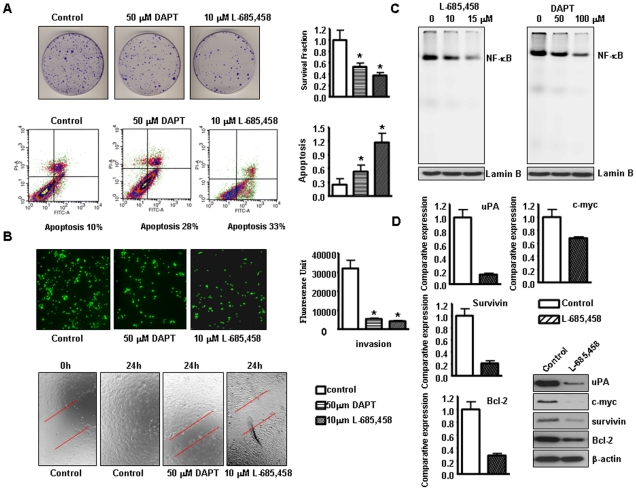
Figure 5. GSI induced apoptosis, inhibited migration and invasion in Rink-1 cells.
A, Top, Left panel: Cell survival of Rink-1 cells treated with GSI. Cells treated with GSI for 72 hours were evaluated by the clonogenic assay. Photomicrographic difference in colony formation in cells untreated and treated with GSI. Right panel: There was a significant reduction in the colony formation in Rink-1 cells treated with GSI compared with control cells. P values represent comparisons between cells treated with GSI and control using the paired t test. Bottom, Left panel: Characterization of apoptosis was carried out after propidium iodide (PI) and Annexin V-FITC staining with apoptosis detection kit followed by flow cytometric analysis after 48 h of GSI treatment of Rink-1 cells. The percentage of apoptotic cells increased from 10% in the control to 28–33% in GSI treated cells. Right panel: GSI induced apoptosis in Rink-1 cells. Rink-1 cells were exposed to GSI for 72 hours. Apoptosis was measured by Histone DNA ELISA. Values are reported as mean ± SD. *P<0.05, compared to the control. B, Top, Left panel, Invasion assay using GSI treated cells showing low penetration of cells through the Matrigel-coated membrane, compared with control cells. Right panel: The graphs showing the value of fluorescence from the invaded Rink-1 cells. The values indicate the comparative amount of invaded Rink-1 cells. Bottom, Wound healing assay was conducted to assess the capacity of cell migration. GSI treatment decreased the cell migration in Rink-1 cells. C, GSI inhibited the NF-κB DNA binding activity in Rink-1 cells as assessed by EMSA. D, Real-time RT-PCR and western blot analysis showed that L-685,458 inhibited the expression of Survivin, c-myc, Bcl-2, and uPA genes.

