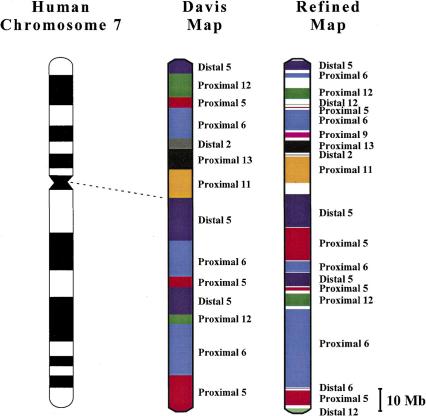
Figure 3.
Overview of human-mouse comparative maps for human chromosome 7. The refined comparative map of human chromosome 7 (see text for details) is shown on the right, along with the corresponding Davis Human/Mouse Homology Map (DeBry & Seldin 1996) (see http://www.ncbi.nlm.nih.gov/Homology) in the middle, and the chromosome 7 cytogenetic map on the left. The Davis map contains 14 orthologous segments from seven regions of the mouse genome. The refined map contains 20 orthologous segments from ten regions of the mouse genome. Evidence for all but one segment, MMU9 (which was defined by new genetic mapping data; J.W. Thomas and E.D. Green, unpubl.), is present in the MGI database. The refined map is drawn to scale, with the size of each established orthologous segment (in color) or unassigned region (white) estimated based on the number of mapped human STSs within the interval [assuming an average inter-STS spacing of 79 kb (Bouffard et al. 1997)]. The sizes of the conserved segments in the Davis map are not drawn to scale.

