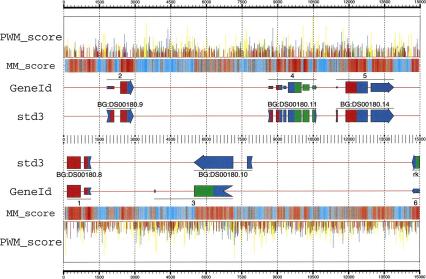
Figure 1.
Predictions obtained by GeneID in the region 462500–477500 from the Adh sequence, compared with the annotation in the standard std3 set. In a first step, GeneID identifies and scores all possible donor (blue) and acceptor (yellow) sites, start codons (green), and stop codons (red) using PWMs—the height of the corresponding spike is proportional to the site score. A total of 4704 sites were generated along this 15,000-bp region by GeneID, only the highest scoring ones are displayed here. In a second step, GeneID builds all exons compatible with these sites. A total of 11,967 exons were built in this particular region (not displayed). Exons are scored as the sum of the scores of the defining sites, plus the score of their coding potential measured according with a Markov model of order 5. The coding potential is displayed along the DNA sequence (MM_score). Regions strong in red are more likely to be coding than regions strong in blue. From the set of predicted exons, the gene structure is generated, maximizing the sum of the scores of the assembled exons. Exons assembled in the predicted genes are drawn with heights proportional to their scores. A two-color code is used to indicate frame compatibility: Two adjacent exons are frame compatible if the right half of the upstream exon (the remainder) matches the color of the left half of the downstream exon (the frame). Data are from the gff2ps program (available at http://www1.imim.es/∼jabril/GFFTOOLS/GFF2PS.html). The input GFF and the configuration files required for gff2ps to generate this diagram can be found at http://www1.imim.es/∼gparra/GASP1.

