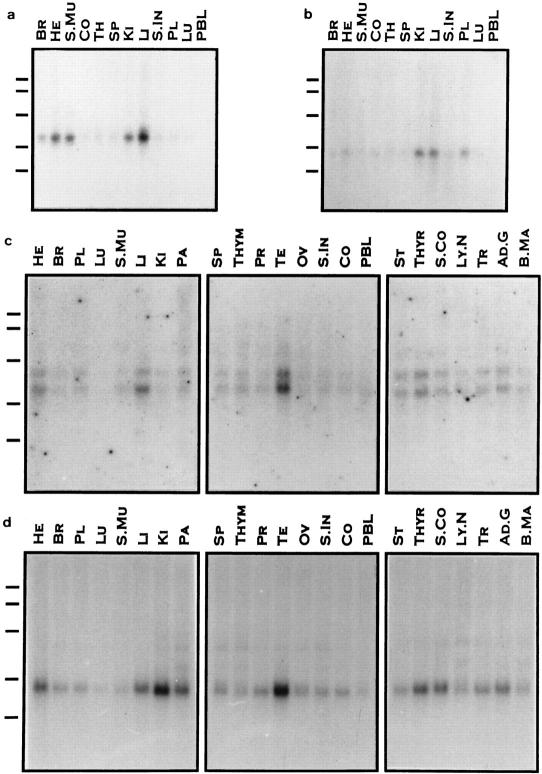
Figure 6.
Northern blot analysis of CGI genes in human tissues. Multiple tissue blots were hybridized with cloned RT-PCR-amplified fragments of human CGI genes as indicated. (a) CGI-2. (b) CGI-19. (c) CGI-1. (d) CGI-13. A and C were exposed for 4 days, whereas B and D were exposed for 10 days. Approximately 2 μg poly(A) RNA from these tissues was loaded in each lane. Tissues are indicated above each lane (BR: Brain, HE: Heart, S.Mu: Skeletal Muscle, CO: Colon, TH or THYM: Thymus, SP: Spleen, KI: Kidney, LI: Liver, S.IN: Small Intestine, PL: Placenta, LU: Lung, PBL: Peripheral Blood Leukocyte, PA: Pancreas, PR: Prostate, TE: Testis, OV: Ovary, ST: Stomach, THYR: Thyroid, S.CO: Spinal Cord, LY.N: Lymph Node, TR: Trachea, AD.G: Adrenal Gland, B.MA: Bone Marrow) and the marker sizes are 9.5 kb, 7.5 kb, 4.4 kb, 2.4 kb and 1.35 kb.

