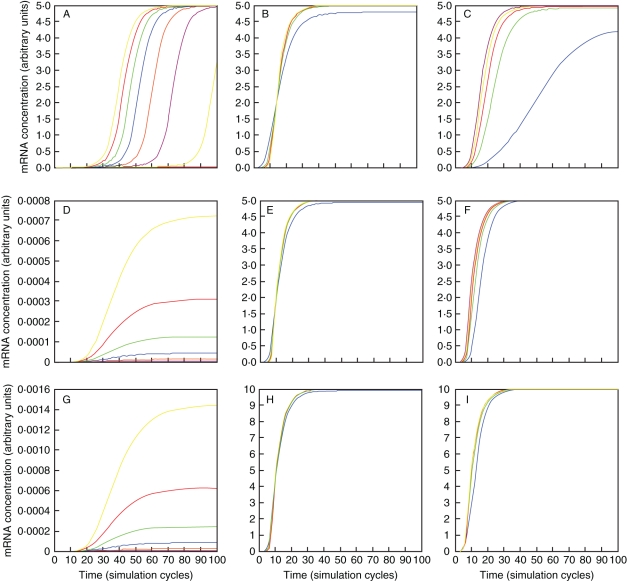
Fig. 5.
Activation of a single downstream gene by B-systems. (A,D,G) Model A, (B,E,H) model B, (C,F,I) model C. (A–C) Activator concentration varies over a 100-fold range. (A) Model A can activate a downstream gene over a wider range of activator concentrations. (B,C) Models B and C require stronger concentrations of activator to activate a downstream gene. (D–F) Hill coefficient of cooperativity in the activation of the downstream gene as shown in the figure varies over a 4-fold range. (D) In model A the downstream gene is most sensitive to variation of the cooperativity coefficient. Model C is most robust because a second complex can activate the same downstream gene independently. (G,H) Rate constant of association for homodimerization (G), heterodimerization (H) or heterodimerization of one or both heterodimers varies over a 100-fold range. Model A using homodimerization is more sensitive to this parameter than model B or C.

