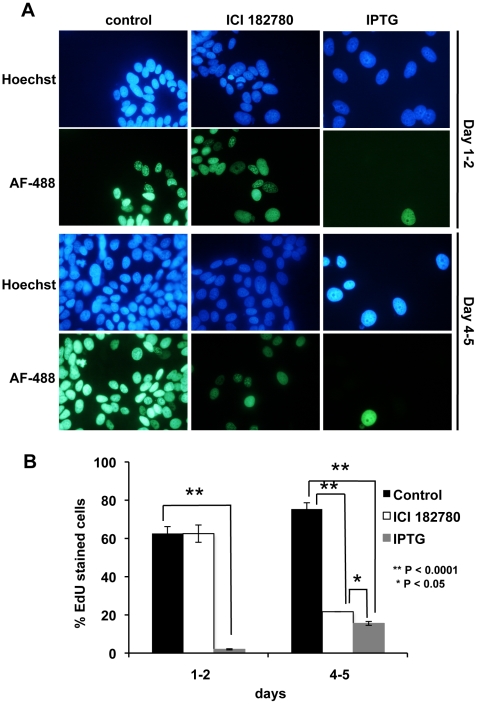
Figure 3. EdU incorporation post ICI 182780 and IPTG (p14ARF) treatment.
Cells were seeded on cover slips and treated with 5 mM IPTG or 10 nM ICI 182780 24 h post-seeding. EdU was added to the medium on days 1 and 4 and cells were incubated for a further 20 h. EdU incorporation was visualized by staining with Alexafluor 488 (green). The nucleus was stained with Hoechst 33342 (blue) and images were taken on a Nikon fluorescence microscope (magnification ×200). Column graph shows % cells staining for EdU compared to Hoechst 33342 stained nuclei (± SE). Experiments were performed in triplicate (duplicate biological experiments). A minimum of 500 cells was counted for each treatment.

