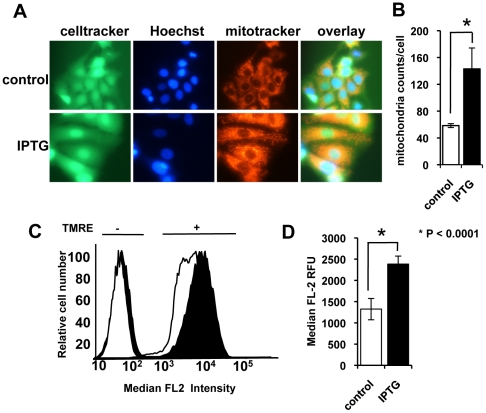
Figure 5. Induction of p14ARF increases mitochondrial biomass and maintains membrane potential.
A. Cells were treated with 5 mM IPTG 48 h post-seeding. At day 3 post-IPTG treatment, live cells were incubated with Mitotracker (red), CellTracker (green) and Hoechst 33342 (blue) and imaged using an inverted fluorescent microscope (magnification ×400). Cells treated with IPTG noticeably increased in size. B. Images processed by high content imaging (magnification ×200) and mitochondria (per cell) counted using BD Attovision™ software. C. Cells were treated with 5 mM IPTG 48 h post-seeding. On day 3 post-IPTG-treatment cells were stained with TMRE for 15 min (+), or left unstained (−) and run through a flow cytometer (IPTG = black, control = white). TMRE-IPTG-treated cells showed increased fluorescence intensity compared to the TMRE-control cells, which is indicative of an increase in ΔΨmt in IPTG-treated cells. D. The median FL2 relative fluorescence units (RFU) of control and IPTG treated cells (day 3) were determined by flow cytometry. The column graph shows the median RFU of TMRE-stained cells minus unstained cells (±SE). This experiment was performed at least twice in triplicate.

