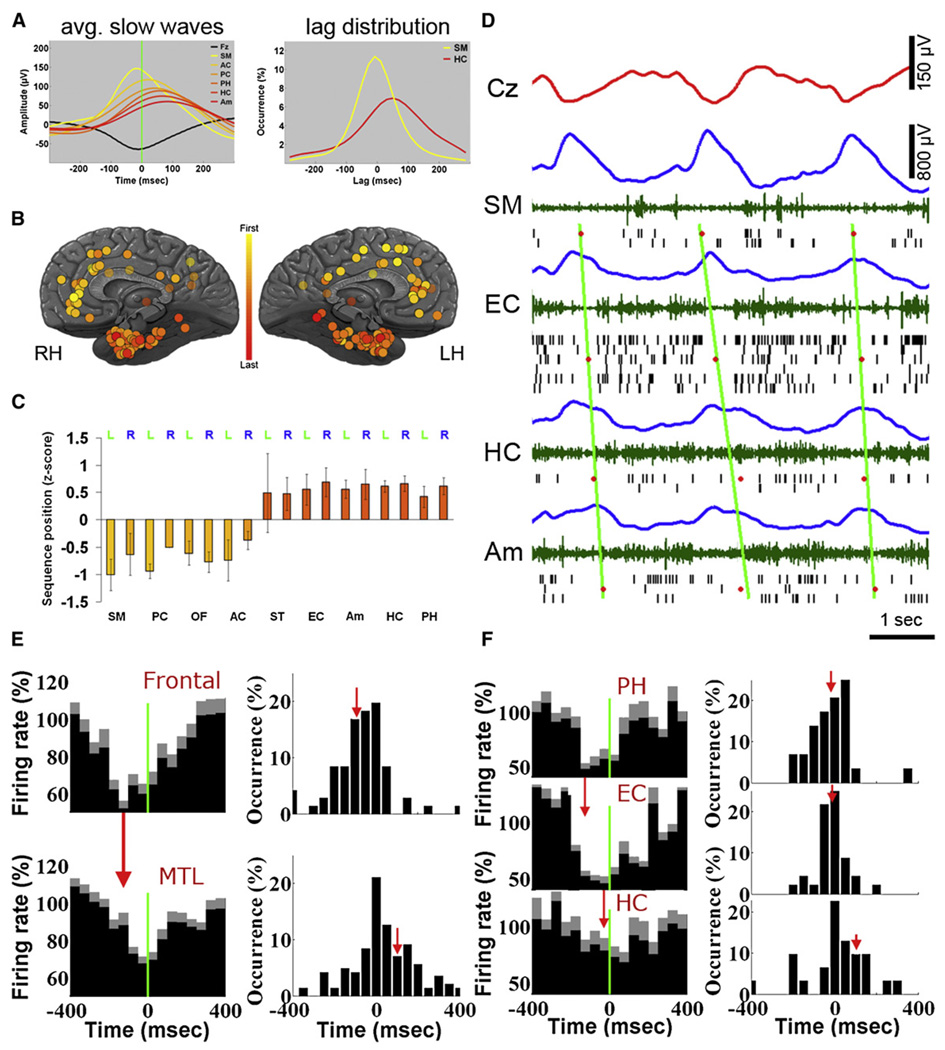
Figure 7. Sleep Slow Waves Propagate Across Typical Paths.
(A) Left: Average depth EEG slow waves in different brain structures of one individual illustrate propagation from frontal cortex (yellow) to MTL (red). All slow waves are triggered by scalp EEG negativity. Black, scalp mean waveform. Right: Distributions of time lags for individual waves in supplementary motor area (SM, yellow) and hippocampus (HC, red) relative to scalp.
(B) Mean position in sequences of propagating waves in all 129 electrodes across 13 individuals. Each circle denotes one depth electrode according to its precise anatomical location. Yellow-red colors denote waves observed sooner in frontal cortex compared with MTL (see legend).
(C) Quantitative analysis: mean position in propagation sequences as a function of brain region. Abbreviations: SM, supplementary motor area; PC, posterior cingulate; OF, orbitofrontal cortex; AC, anterior cingulate; ST, superior temporal gyrus; EC, entorhinal cortex; Am, amygdala; HC, hippocampus; PH, parahippocampal gyrus.
(D) An example of individual slow waves propagating from frontal cortex to MTL. Rows (top to bottom) depict activity in scalp EEG (Cz, red), supplementary motor area (SM), entorhinal cortex (EC), hippocampus (HC), and amygdala (Am). Colors denote the following: blue, depth EEG; green, MUA; and black lines, spikes of isolated units. Red dots mark center of OFF periods in each brain region based on the middle of silent intervals as defined by last and first spikes across the local population. Diagonal green lines are fitted to OFF period times via linear regression and illustrate propagation trend.
(E) Left: The average unit activity in frontal cortex (top, n = 76) and MTL (bottom, n = 155), triggered by the same scalp slow waves reveals a robust time delay (illustrated by vertical red arrow). Right: Distribution of time delays in individual frontal (top) and MTL (bottom) units reveals a time delay of 187 ms. Red vertical arrows denote mean time offset relative to scalp EEG.
(F) Left: The average unit activity in parahippocampal gyrus (PH, n = 32), entorhinal cortex (EC, n = 49) and hippocampus (HC, n = 35), triggered by the same depth EEG slow waves reveals a cortico-hippocampal gradient of slow wave occurrence (illustrated by vertical red arrows). Right: Distribution of time delays in individual PH, EC, and HC units reveals a time delay of 121 ms between PH and HC. Red vertical arrows denote mean time offset relative to depth EEG.

