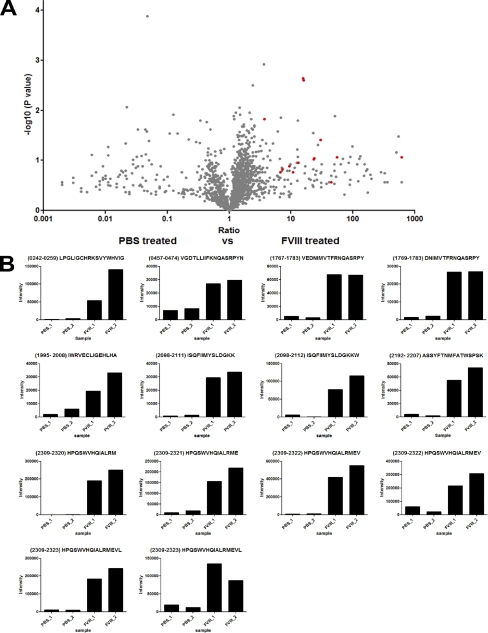
Fig. 3.
Identification and relative quantification of MHC class II-bound FVIII peptides. A, Volcano plot representation showing reproducibly detected peptide ions across duplicate analyses. MoDCs from donor A (DRB1*0101, 1301) were used. Cells were treated with either 100 nm FVIII or with PBS. All samples were immunoprecipitated using an anti-MHC class II antibody. Experiments were performed in duplicate. SIEVE was used to compare intensities of individual peptides obtained from FVIII and PBS treated cells. Only peptides that were derived from MS2 spectra are depicted. Peptides identified as FVIII-derived peptides are indicated in red. B, Peak intensities of all identified FVIII peptides are shown for experimental and control samples. It should be noted that the sets of FVIII peptides that were identified in the analysis presented in Fig. 3B when compared with Fig. 2B are not completely identical. The reason for the observed differences between Fig. 2B and 3B is that these particular peptides were filtered out by the algorithms employed by SIEVE during the comparison, due to local spectral differences. Manual analysis of the raw data files revealed that all peptides depicted in Fig. 2B and 3B were indeed present in the duplicate samples prepared from FVIII-treated cells using L243 (MHC class II specific) Sepharose.

