Fig. 5.
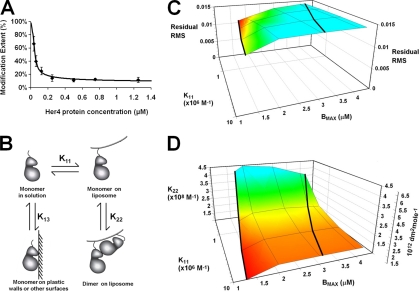
A, Titration curve of Glu-847. The Her4 kinase-domain protein solution concentration is listed on the X axis. The black dots are modification extents of Glu-847 on different protein concentrations. Glu-847 titration curve modeling by Her4 dimer on Ni liposome with parasitic binding site model. Black line is the curve generated by the best fit model. B, Her4 kinase-domain exists in four possible states: free monomer in solution, monomer on liposome surface, dimers on liposome surface, and binding of Her4 to plastic walls or other surfaces. C, The root mean square of the residuals from the model fits as a function of monomer-to-liposome association constant (K11) and liposome binding capacity (Bmax). Results for Bmax equal to 1 × 10⁻⁶ m are not shown because the model curves clearly show bias and the RMS is greater than 0.034 for these fits. The association constants K11 are given in M−1. D, Her4 dimer association equilibrium constant (K22) versus monomer-to-liposome association constant (K11) and liposome binding capacity (Bmax). The right-most vertical axis shows K22 in protein surface density units (dm2/mol) and the left-most vertical axis shows K22 in bulk phase molar units (M−1). As in C, the results for Bmax equal to 1 × 10⁻⁶ m are not shown because the model curves clearly show bias, with the RMS of the residuals being greater than 0.034 and the K22 values becoming very large (>109 m−1).

