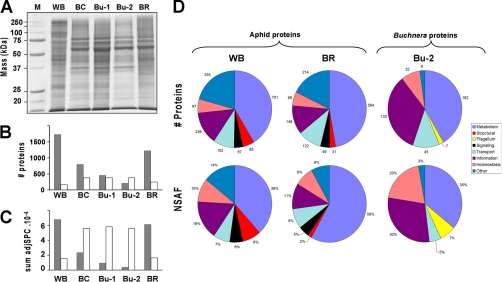
Fig. 3.
The proteome of the pea aphid and bacteriocyte fractions. A, 1D-SDS-PAGE gel lanes of the five different types of fractions (WB, BC, Bu1-, Bu-2, and BR) stained with Coomassie Brilliant Blue. Only one of the three independent biological replicates is shown here. B, C, Total number of proteins (B) and total mass of proteins (C) based on NadjSPC of aphid origin (gray) and Buchnera origin (white). D, Functional classification of quantified proteins, expressed as number of proteins (top row) and abundance, expressed as mean NSAF normalized to total aphid or Buchnera proteins (bottom row). Details (protein accession number and individual NadjSPC and NSAF) can be found in supplemental Table S1B.

