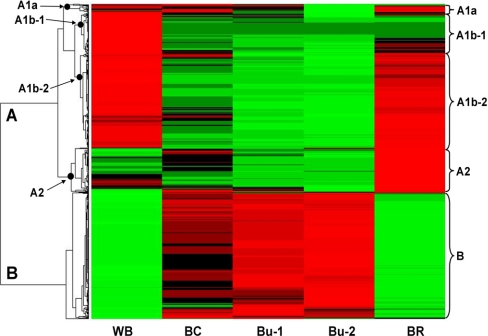
Fig. 4.
Hierarchical cluster analysis of protein distribution across the five fractions. The abundance is indicated by the colors, expression increased from green to black to red. There are two main clusters (A and B), with cluster A divided in four subclusters. Accessions numbers in each of these clusters can be found in supplemental Table S1B. None of the Buchnera proteins were found in cluster A.

