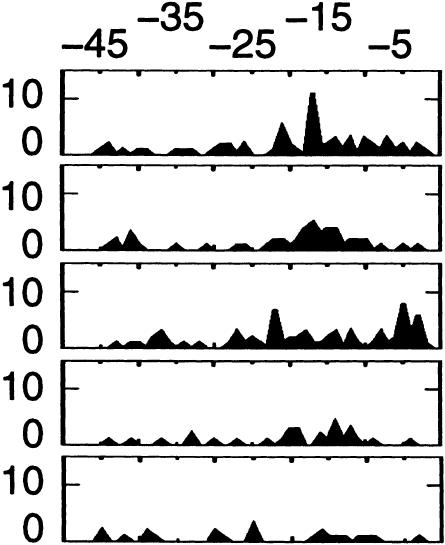
Table 3.
Most Significant Hexamers in 3′ Fragments: Scattered Hexamers
| Hexamer | Observed (expected)a | % sites | Pb | Position average ± SD | Locationc | |||
|---|---|---|---|---|---|---|---|---|
 |
62 (10) | 1.1 | 9 × 10⁻²⁸ | −19 ± 11 |  |
|||
| 49 (10) | 0.8 | 4 × 10⁻¹⁸ | −20 ± 10 | |||||
| 69 (20) | 1.2 | 3 × 10⁻¹⁸ | −17 ± 12 | |||||
| 29 (5) | 0.5 | 8 × 10⁻¹² | −20 ± 10 | |||||
| 22 (3) | 0.3 | 9 × 10⁻¹² | −24 ± 13 | |||||
Expected occurrences based on a random distribution in a database of same nucleotide composition.
Probability of reaching the observed frequency by chance based on a cumulative binomial distribution. All sequences containing the most significant hexamer were removed from the database before the next most significant hexamer was sought.
Location of the last base of hexamer. Position 0 is the putative poly(A) site.
