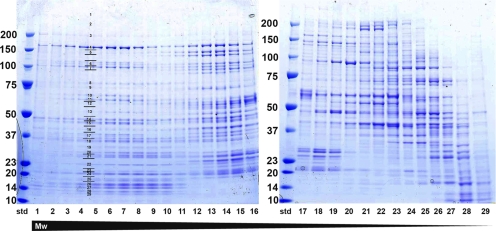
Fig. 1.
SDS-PAGE gel of individual fractions after sucrose gradient fractionation of the cytoplasmic fraction of mouse macrophages. Protein complexes present in the cytoplasmic fraction were separated according to their size by ultracentrifugation over sucrose gradient. After concentration of each of the 29 fractions, 20 μl was applied to SDS-PAGE, in order to separate proteins present in each particular fraction (fraction 1 represents fraction at the bottom of the gradient, fraction 29 represents the fraction at the top of the gradient; std, molecular mass standards with masses indicated). For the proteomic analysis, every band from SDS-PAGE gel was excised (as indicated as an example for fraction 4) and subjected to in-gel trypsin digestion followed by peptide mass fingerprinting by MALDI-TOF.

