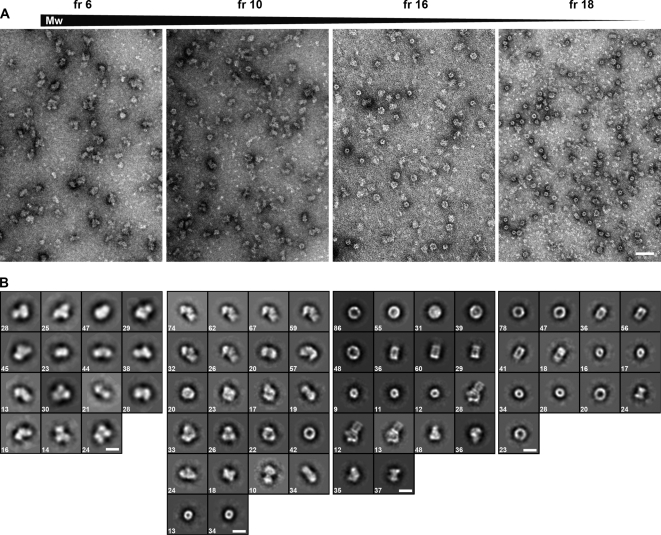
Fig. 3.
Structures of assemblies in different fractions as visualized by electron miscroscopy. A, Electron micrographs of representative sucrose gradient fractions (from left to right: fr 6, fraction 6; fr 10, fraction 10; fr 16, fraction 16; fr 18, fraction 18) after negative staining. Scale bar: 50 nm. B, Galleries of selected final two-dimensional averages of putative macromolecular complexes (corresponding to different classes) from the fractions shown in (A). Scale bars: 20 nm. Numbers in the lower left corner indicate the number of particles from which the final average was calculated. Fraction 18 contains 20S proteasome particles.

