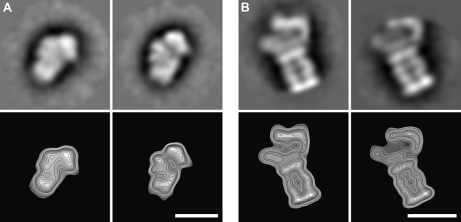
Fig. 4.
Assemblies with known structures can be observed in sucrose gradient fractions. The calculated final class averages (upper panels) and electron-density contour maps (lower panels) are shown after single-particle analysis of selected particles. Based on the proteins identified in the relevant fraction and the comparison with the published structures, the assemblies may correspond to: A, The small ribosomal subunit (30); B, The 26S proteasome complex (31). Scale bars: 20 nm.

