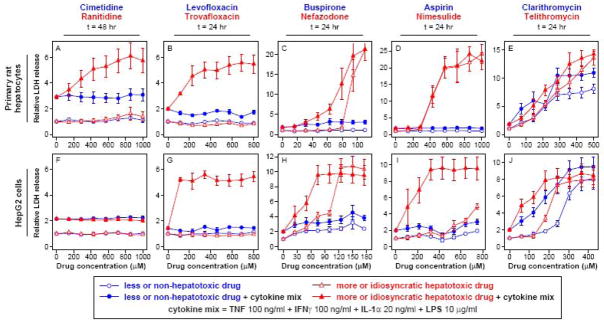
Figure 1.
Identification of drug dose-dependent hepatotoxicity synergies between a cytokine mix and multiple idiosyncratic hepatotoxic drugs in primary rat hepatocytes (panels A-E) and HepG2 cells (panels F-J). Primary rat hepatocytes and HepG2 cells were cultured, treated, and assayed for LDH (at 24 or 48 hours post-treatment) as described in Methods. Drugs were dosed at varying concentrations in the presence or absence of a cytokine mix containing 100 ng/ml TNF, 100 ng/ml IFNγ, 20 ng/ml IL-1α, and 10 μg/ml LPS. LDH release values were fold-change normalized to DMSO/no cytokine control samples from the same cell system. (Note that LDH release axes are separately scaled for each plot.) Drugs from similar chemical class and/or molecular target are plotted together, with the less or non-hepatotoxic “comparison” drug in blue and the more idiosyncratic hepatotoxic drug in red. Data are presented as mean ± SEM of four biological samples. Results from additional time points, with drug doses plotted with respect to both molecular concentrations and drug Cmax values, are shown in Figures S1–S5.

