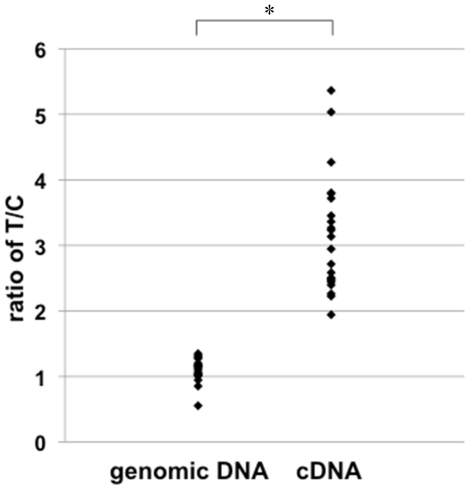
Figure 2. Allelic difference in MBP transcription using allele specific quantitative RT-PCR.
The amount of MBP primary transcripts transcribed from chromosomes carrying rs2000811 risk (T) and alternative (C) alleles was compared in each cell line, and the ratio (T/C) was plotted. Genomic DNA was used as a control for equimoler biallelic representation. Experiments were done twice independently.

