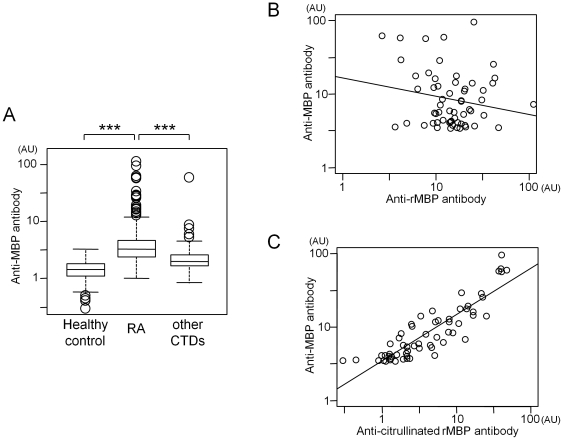
Figure 4. Quantification of circulating antibodies against MBP protein.
A. Each boxplot indicates distribution of anti-MBP antibody titers in healthy controls, in RA patients, and in other connective tissue diseases (CTDs) (for detailed composition of the disease patients, see materials and methods). Results were representative of the two independent experiments. *** indicates statistical p-value smaller than 0.001. B. Correlation of autoantibody levels between human brain-derived MBP and recombinant MBP (rMBP). C. Correlation of autoantibody levels between human brain-derived MBP and citrullinated rMBP. Sixty RA patients who were positive for anti-MBP antibody were used for the analysis. In each figure, antibody titers were shown as arbitrary unit (AU).

