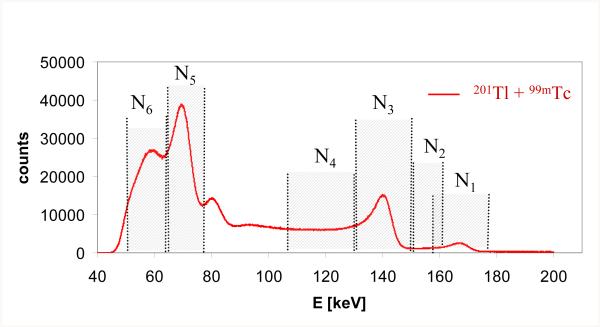
Figure 1.
A combined energy spectrum for 99mTc and 201Tl is plotted together with the energy windows selected for the dual radionuclide acquisition (N1-N6). These correspond to photopeaks for the two radionuclides (N1, N3, N5) and energy windows that estimate scatter and cross-talk (N2, N4, N6). Note that the algorithm can accommodate overlapping windows (e.g. N1, N2).

