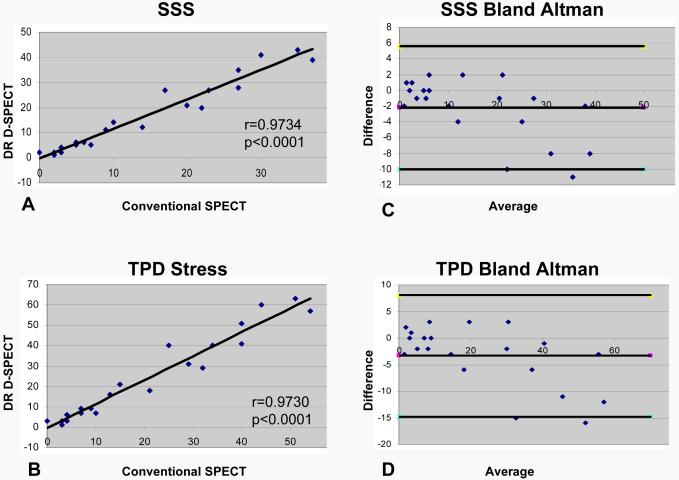
Figure 4.
Correlation between DR D-SPECT and conventional SPECT for (A) summed stress score (r=0.9790, p<0.0001) and (B) % total perfusion defect at stress (r=0.9784, p<0.0001). Bland-Altman graphs showing good agreement between SSS (C) and % total perfusion defect (D) of DR D-SPECT and conventional SPECT with a mean difference of −2.0, 95% confidence interval −2.392-1.991 for SSS; mean difference −3.0, 95% confidence interval −3.42-3.076 for % TPD stress.
DR=dual radionuclide; SSS= summed stress score; %TPD= % total perfusion defect.

