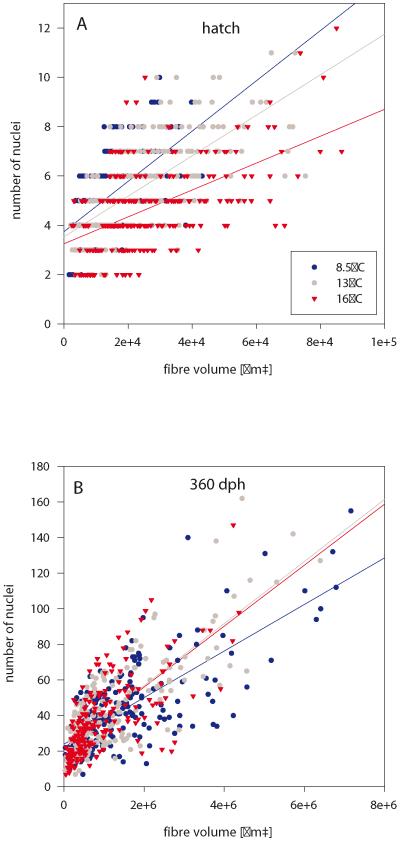
Fig. 7.
Myonuclear densities of isolated fast fibres. Relationship of nuclei/fibre volume at hatching (A) and 360 dph (B). Images exemplify nuclei visualisation in isolated single fast muscle fibres of 13°-fish using Hoechst 33258. Scale bars: 100 μm. Regression line equations: (A) 8.5°C: y = 1.02x + 3.74 (r2 = 0.36, p<0.01), 13°C: y = 8.21x + 3.54 (r2 = 0.48, p<0.01), 16°C: y = 5.46x + 3.25 (r2 = 0.29, p<0.01); (B): 8.5°C: y = 1.31x + 24.00 (r2 = 0.55, p<0.01), 13°C: y = 1.74x + 21.94 (r2 = 0.66, p<0.01), 16°C: y = 1.71x + 21.72 (r2 = 0.48, p<0.01).

