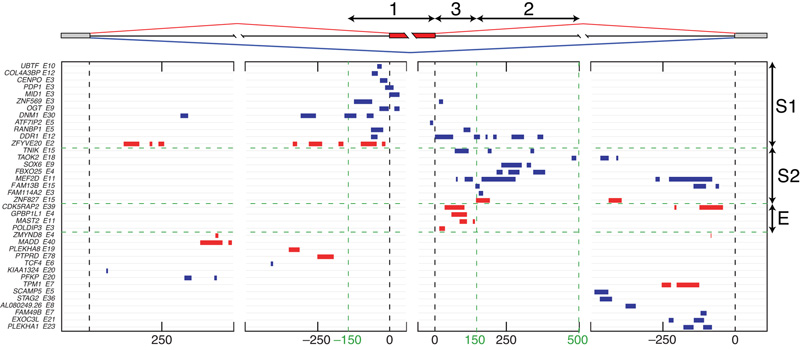
Figure 3. The RNA splicing map of TDP-43.
The map of crosslink clusters at positions within 500 nt of alternative exons and flanking exons. The cassette exons with ΔIrank > 1 (enhanced exons, red clusters) or ΔIrank < −1 (silenced exons, blue clusters) with at least one crosslink cluster in these regions are shown. The exons are grouped by sequential analysis of crosslink cluster positions in three regions: group S1 is identified by clusters in region 1, 150nt upstream till the exon and within the exon; group S2 by clusters in region 2, 150–500nt downstream of the exon; and group E by clusters present 0–150nt downstream of the exon.

