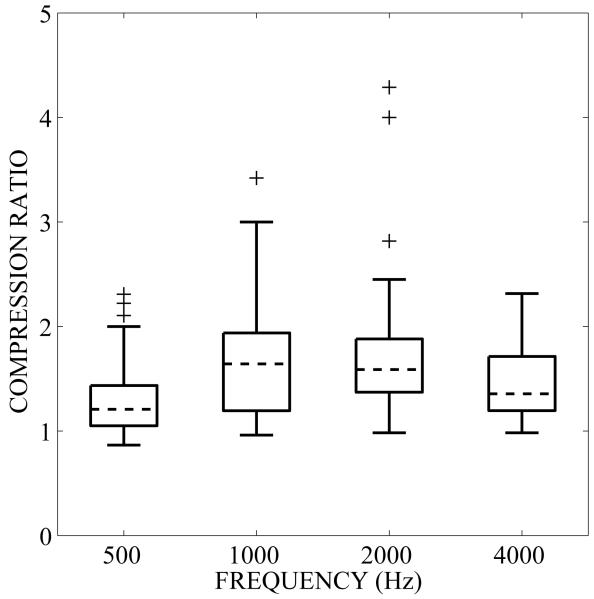
Figure 2.
Compression ratio as a function of frequency computed from measured outputs at 60- and 80-dB SPL input, averaged across bilateral fittings. Lines represent medians, boxes represent lower and upper quartile of data, bars represent 1.5 × inter-quartile range. Outliers outside 1.5 × inter-quartile range are marked with crosses.

