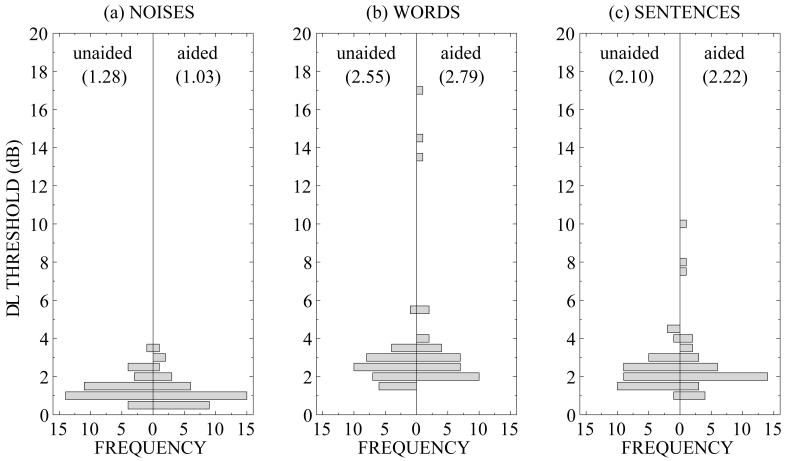
Figure 3.
Frequency histograms of level-discrimination thresholds for hearing-impaired participants grouped in 0.5-dB bins for unaided (left panel) and aided (right panel) conditions with long-term-average speech-spectrum noise (a), mono-syllabic words (b) and sentences (c). Median values are given in parentheses. For aided word and sentence stimuli, there were several thresholds that were much greater than the general distribution.

