
Figure 3.
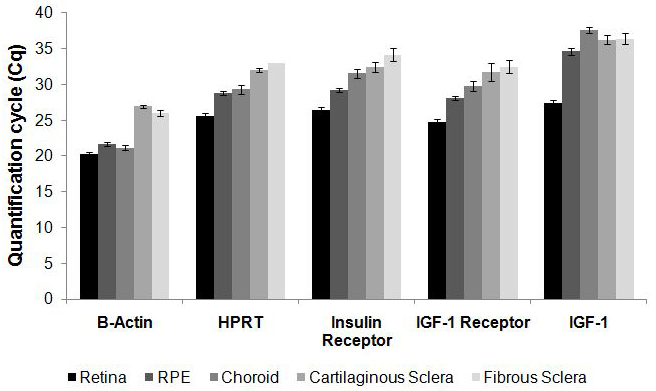
Quantification cycle values for all genes in all fundal layers are shown. The mRNA for the insulin receptor and insulin-like growth factor receptors is most abundant in the retina, followed by the RPE, choroid, cartilaginous and fibrous sclera. The sample size is 6 animals per tissues. Error bars represent the standard error of the mean.