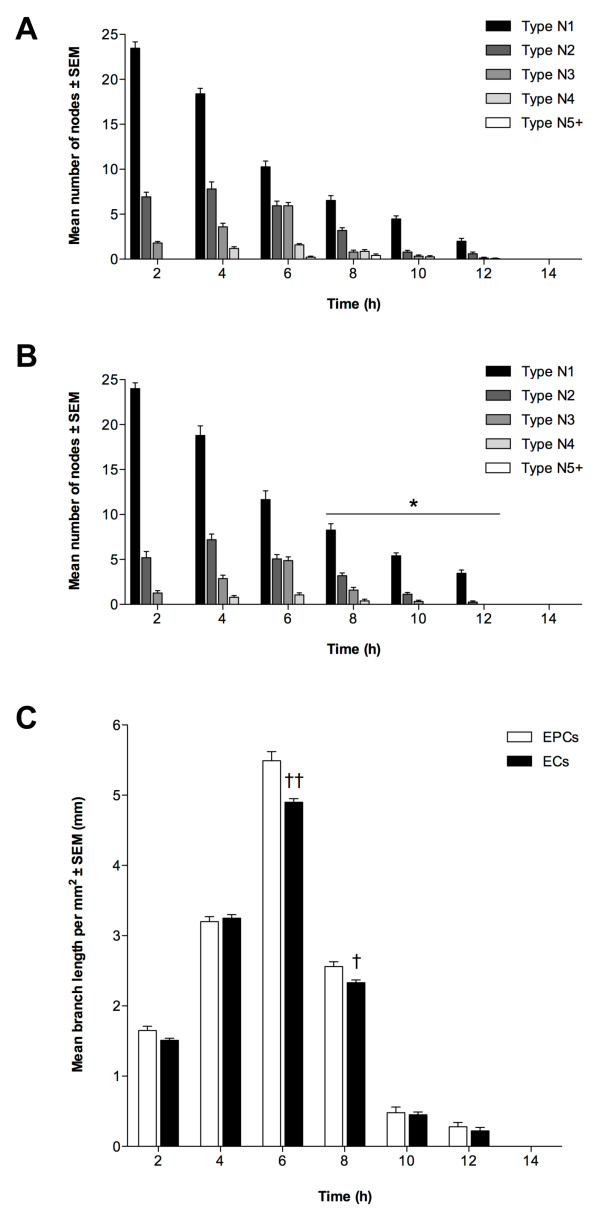
Figure 2.
Angiogenic potential of EPCs and ECs. Tubule formation of (A) EPCs and (B) ECs quantified by node counting. Presented as mean node number ± SEM (n = 3); *P < 0.05 vs. EPC nodes at same time-point. (C): Branch measurements, as mean length per mm2 ± SEM (n = 3); †P < 0.05, ††P < 0.01 vs. EPC branch length at same time-point.

