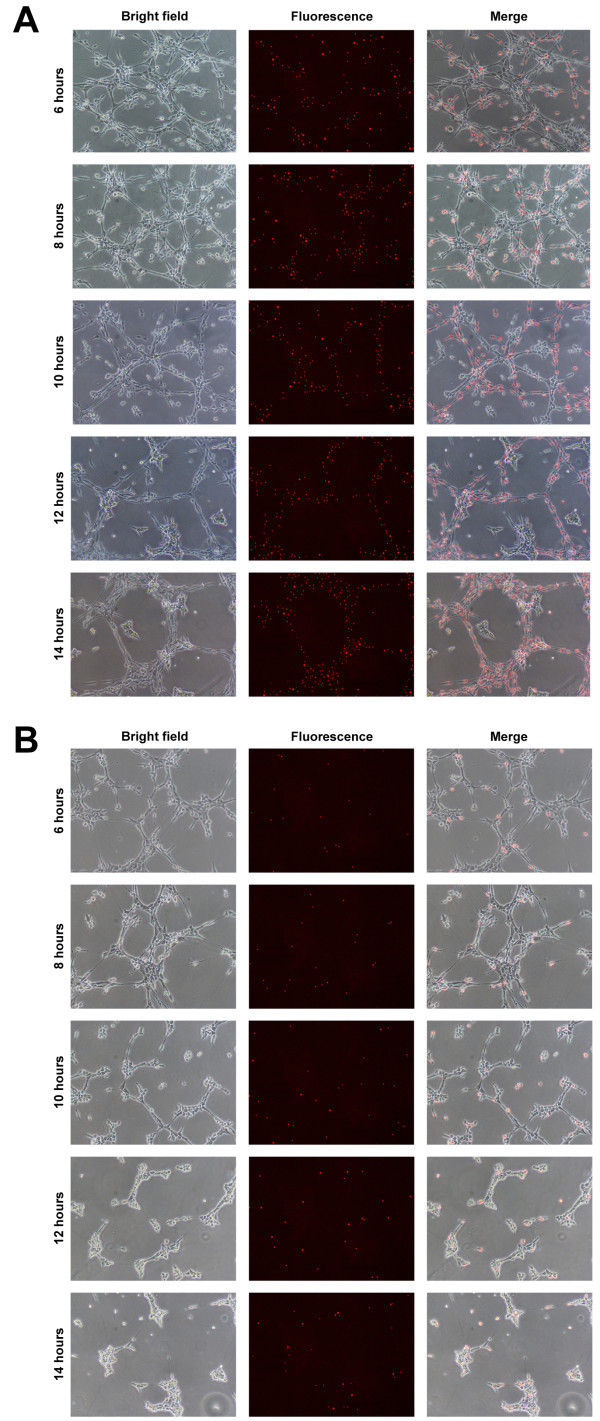
Figure 7.
Localisation of EPCs following in vitro transplantation. Transplantation into EC tubules performed using 50% (4 × 10⁴) or 10% (8 × 10³) Qdot-labelled EPCs at 5 h. EPC localisation in (A) 50% and (B) 10% transplantation assays, showing bright field, fluorescence and merged images from 6-14 h at 2 h intervals. Scale bars = 500 μm.

