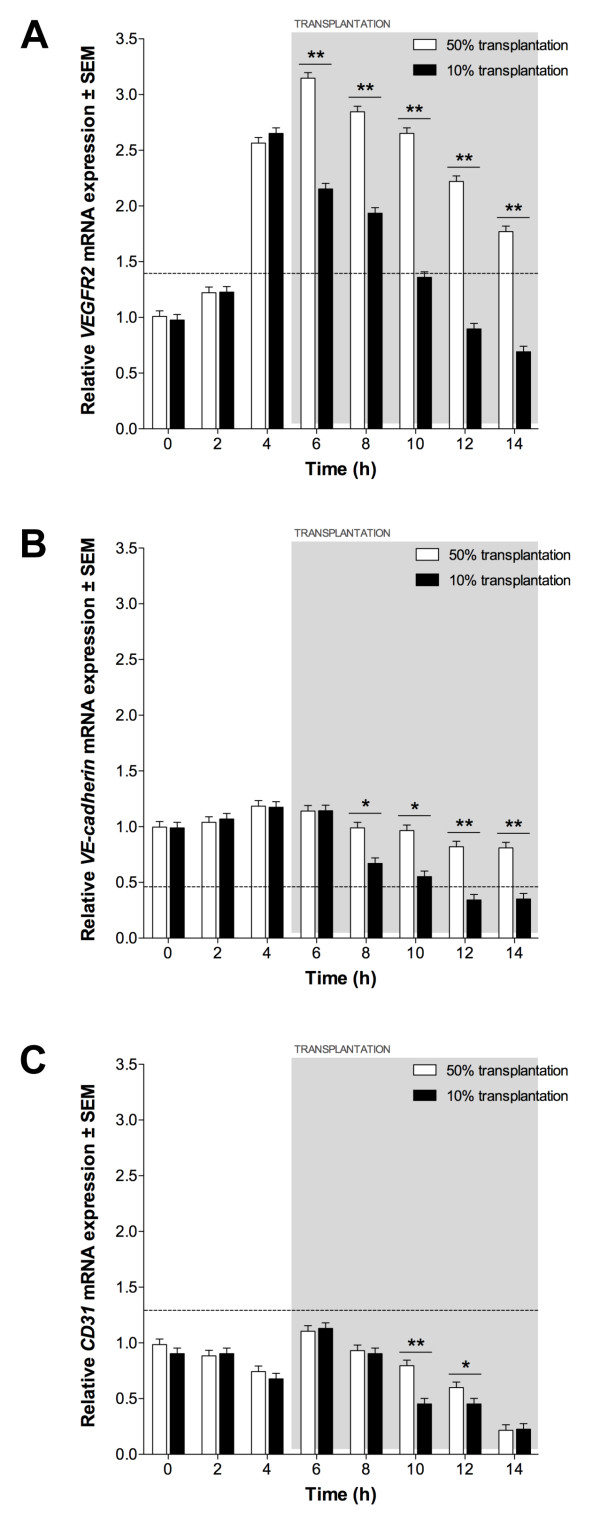
Figure 8.
Endothelial expression following EPC transplantation. (A) VEGFR2, (B) VE-cadherin and (C) CD31 expression in 50% and 10% transplantation assays, relative to expression in 60% confluent ECs. Dotted line indicates expression in 60% confluent EPCs. Significant differences between transplantations indicated (*P < 0.05, **P < 0.01).

