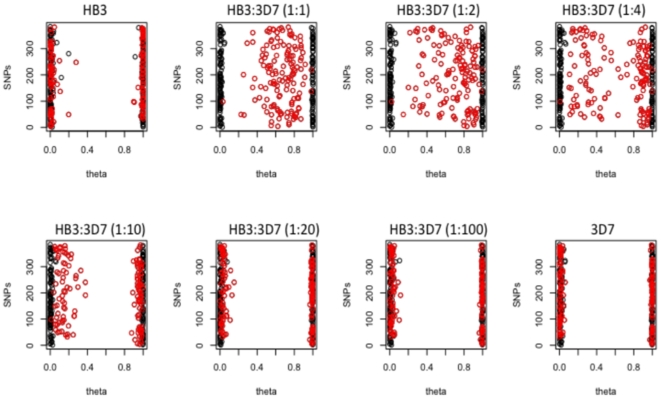
Figure 1. Distribution of theta values (proxy to genotype call) at 319 “reliable” SNPs in preparations from the laboratory clones 3D7 and HB3, and in artificial mixtures of the two clones.
Mixing proportions of the clones (HB3:3D7) are indicated in brackets. Red dots represent the SNPs that should have heterozygous genotypes in the artificial mixes (according to the genotypes from the haploid pure samples), black dots represent the SNPs for which both samples have the same genotype. Theta values approximating 0.5 correspond to having both alleles approximating 50% frequency. Values approximating 0 and 1 correspond to homozygous calls for allele a or b. In the pure clonal 3D7 and HB3 samples, the majority of genotype calls exhibit theta values <0.1 and >0.9.

