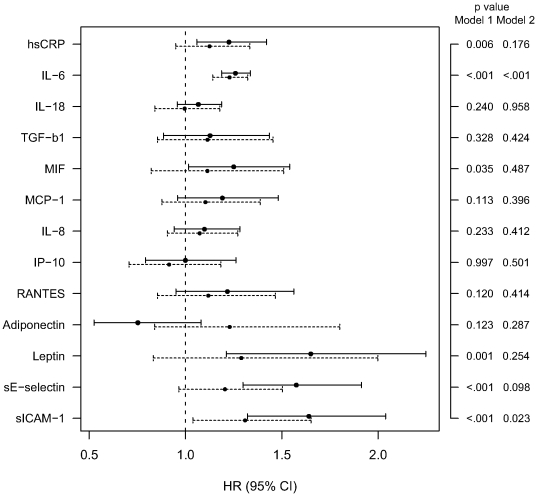
Figure 2. Hazard ratios (95% CI) for incident coronary events for z-transformed inflammation-related biomarkers.
Solid lines (model 1): each biomarker adjusted for age, sex and survey. Dashed lines (model 2): each biomarker adjusted for age, sex, survey, BMI, systolic blood pressure, ratio of total cholesterol to HDL cholesterol, smoking, alcohol consumption, physical activity, parental myocardial infarction and prevalent diabetes.

