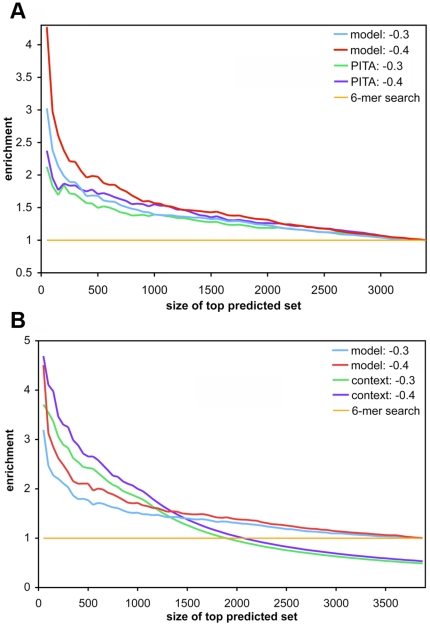
Figure 5. Comparison of the prediction model to other existing tools.
(A) Our model score vs PITA score. Model-predicted scores and enrichment values were computed as in Figure 4C. We used PITA scores with flanking length of 3 and 15 bases upstream and downstream, for which the original study reported better performance compared to no flanking region [9]. (B) Our model score vs TargetScan's context score. Models from the 6-mer training set were used (cf. Figure 4C). TargetScan UTRs without the required canonical sites (i.e. no context score) were ranked at the bottom of the predicted list.

