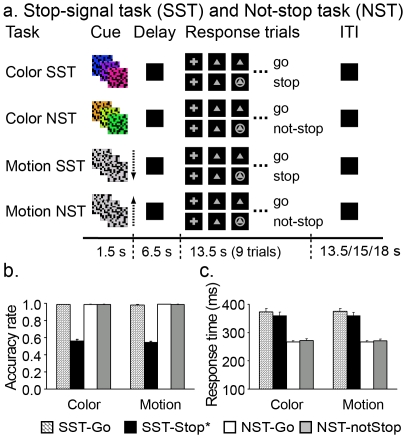
Figure 1. Behavioral tasks and behavioral data.
a, A schematic diagram of the task conditions. The present experiment included two visuomotor tasks - a stop signal task (SST) and a not-stop task (NST). Each task was cued by a color and a motion stimulus, forming a total of 4 conditions (color-SST, color-NST, motion-SST and motion-NST). There were three task epochs: cue, delay and a block of response trials. A visual cue (color or motion) was presented at the beginning to indicate the current rule for the response epoch (SST or NST). After a 6.5-sec delay (black screen), a warning signal was presented for 1 sec (not shown) followed by a block of 9 response trials. For both tasks, a go signal was presented on every trial that was occasionally followed by a stop signal (circle) at variable delays (see Methods). Subjects were told to try their best to withhold their response in the presence of the stop signal for the SST but to ignore it (and make their response) for the NST. The inter-task interval varied between 13.5, 15 and 18 sec. b, Average response accuracies for go (SST-Go) and stop (SST-Stop) trials in the SST and go (NST-Go) and not-stop (NST-NotStop) trials in the NST by cue type. c. Average response times across trial types. *SST-Stop refers to all stop trials in b and unsuccessful stop trials in c.

