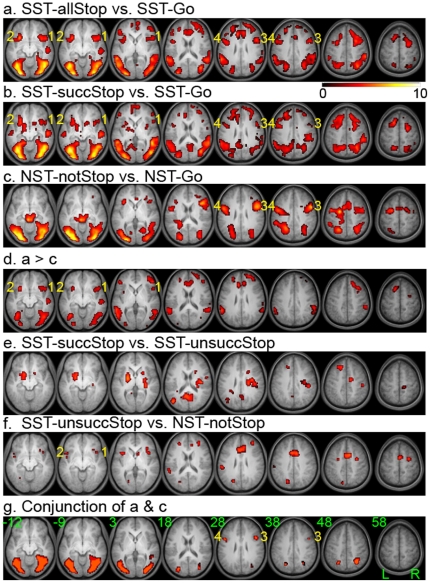
Figure 2. Group contrast maps showing transient activations during response control.
a. Widespread activations shown by contrasting all stop trials and go trials of the SST. b. Activations revealed by contrasting the successful stop trials and go trials of the SST. c. Activations shown by contrasting the not-stop trials and go trials of the NST. Note that less parts of IFC showed suprathreshold activation. d. Activations revealed by directly comparing a and c. e. Activations revealed by contrasting the successful and unsuccessful stop trials of the SST. f. Activations revealed by contrasting the unsuccessful stop trials of the SST and the not-stop trials of the NST. These two types of trials were similar in both frequency and motor output. g. Conjunction maps showing activations that are suprathreshold in both contrasts, SST-allStop versus SST-Go and NST-notStop versus NST-Go. Within the IFC, suprathreshold activation was only observed in the dorsal posterior IFG. All the contrast maps were thresholded at p<0.05 (FDR corrected) and overlaid on anatomical images averaged across the group. The numbers in the bottom row indicate the z level of the transverse slices in mm. Activation labels: 1, right ventral-posterior IFG; 2, left ventral-posterior IFG; 3, right dorsal-posterior IFG/IFJ; 4, left dorsal-posterior IFG/IFJ.

