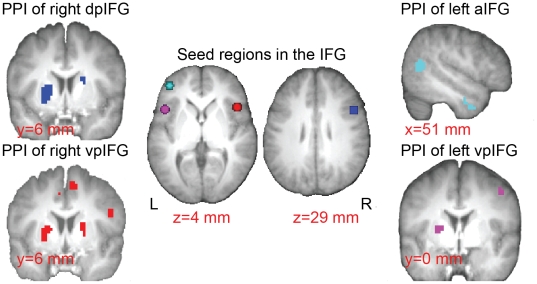
Figure 4. Psychophysiological interactions of IFG subregions during response control.
The images in the center illustrate the IFG subregions on the axial slices. The functional connectivity of each IFG region during the response blocks of SST versus NST is shown on the side (neurological orientation: right = right). The right dpIFG (average MNI coordinates: x = 51, y = 14, z = 29) showed stronger interactions with the striatum. The left aIFG (x = −42, y = 46, z = 7) showed stronger interactions with the right middle temporal gyrus. The right vpIFG (x = 47, y = 20, z = 0) showed stronger interactions with striatum, premotor cortex and supplementary motor area. The left vpIFG (x = −47, y = 17, z = 0) showed stronger interactions with striatum and premotor cortex. All PPI maps were presented at threshold of p<0.001, uncorrected. Abbreviations: aIFG: anterior inferior frontal gyrus; vpIFG: ventral-posterior IFG; dpIFG: dorsal-posterior IFG.

