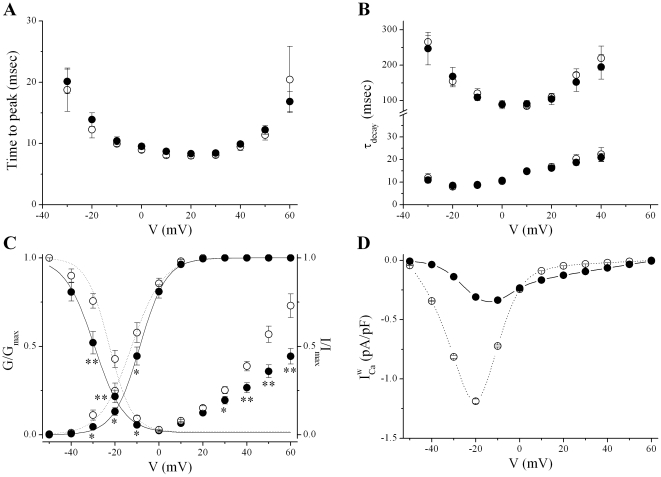
Figure 2. CPVT cells demonstrated rightward and leftward shifts in the voltage-dependent activation and inactivation of ICa, respectively.
A. Activation kinetics of ICa over the whole voltage range were not significantly different between WT (open symbols) and CPVT (filled symbols) cells. B. The time course of inactivation of ICa, which encompass slow and fast components, were similar in WT and CPVT cells at all voltages studied. C. Superimposed voltage-dependence of ICa activation and inactivation. ICa activationis shifted to more positive values in CPVT vs WT cells, whereas inactivation of ICa is shifted to more hyperpolarized potential in CPVT cells compared with WT cells. D. Voltage dependence of ICa window current ( ) display a bell-shaped voltage-dependence, however, the peak of
  is reduced in CPVT cells (continuous line) compared to WT cells (dashed line). * P<0.05 and ** P<0.005.

