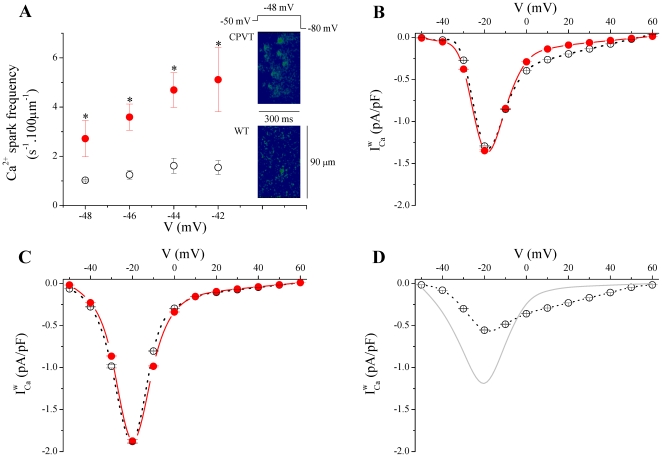
Figure 3. Increased Ca2+ spark occurrence limits ICa window current ( ).
).
A. Analyze of the patch clamped-Ca2+ sparks revealed that the average of Ca2+ sparks frequencies in CPVT cells (filled circles, n = 10) were significantly higher compared to WT cells (open circles, n = 3). * P<0.05. Right insets. Representative examples of line-scan images of Ca2+ sparks elicited by depolarizing step to −48 mV. B & C. BAPTA dialysates (B) and thapsigargin-treatment (C) eliminates the difference in  between CPVT and WT cells. D. In presence of Ryanodol in the perfusion solution,
  is reduced in WT cells compared to control condition, shown as light gray line.

