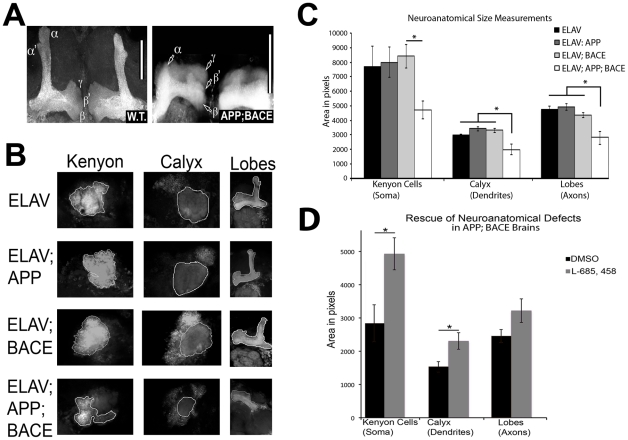
Figure 3. Defects in AD fly neuroanatomy.
A) Mushroom body from elav-CD8-GFP; +; + heterozygous fly brain (left) displays normal axonal lobes. The same region in elav-CD8-GFP; APP; BACE heterozygous fly brain (right) displays significantly altered axonal lobes. These lobes are labeled. Note the complete loss of α′ lobe in elav-CD8-GFP; APP; BACE heterozygous fly brain. Scale bars indicate 50 µm in both panels. B) Examples of Kenyon cell (KC) substructures measured in the indicated genotypes. Kenyon indicates KC cell soma. Calyx indicates KC dendritic field. Lobes indicate KC axonal field. C) Neuroanatomical surface area measurements. Genotypes and substructures indicated. * indicates p<0.05, with exact values listed in text. D) Pharmacological rescue of neuroanatomical surface area decreases in elav-CD8-GFP; APP; BACE heterozygous fly brains. Treatments indicated. * indicates p<0.05, ANOVA analysis with exact values listed in text. Error bars represent standard error in each case.

