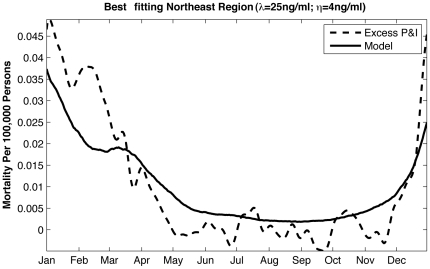
Figure 2. Best-fitting SIRS model simulation for the northeastern U.S. with
parameters λ and η fixed at  and
and
 .
.
Other parameters are shown in the top line of Table 3. The 31-year simulated mean daily infection number has been scaled to the observed 1972–2002 mean daily excess P&I mortality rate for New York state.

