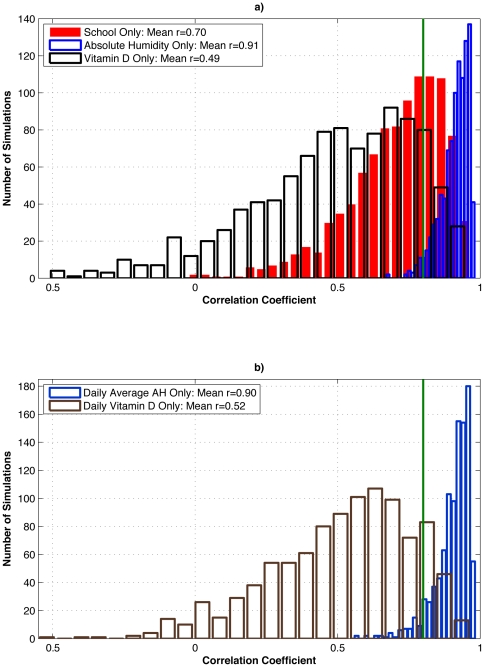
Figure 3. Test of the effect of stochasticity within the SIRS model on well-matched simulations verified with New York state P&I mortality data.
a) The 10 best-fit parameter combinations for the SIRS model forced with observed New York school calendar (Shaman et al., 2010: Table S5), observed New York absolute humidity (Shaman et al., 2010: Table S2), and northeastern U.S. vitamin D metabolite levels (Table 3) were each run an additional 100 times, each time with different random seeding. Histograms of correlations with 1972–2002 New York state observed excess P&I mortality are shown. The green line indicates the correlation of an optimally phased sine function with annual periodicity with 1972–2002 New York state observed excess P&I mortality (r = 0.80). b) As in a), but for the 10 best-fit simulations using 1972–2002 daily average New York absolute humidity and daily interpolated northeastern U.S. vitamin D metabolite levels.

